1. Calibrating Quadrupole ICP-MS Data
This example will guide you through importing, calibrating and exporting single-particle data collected on a quadrupole ICP-MS. A 15 nm gold NP is used as a sample, with a 50 nm gold NP as a reference. A sample is loaded and then calibrated using the Reference Particle method described in Calibration.
Parameter |
Location |
Value |
|---|---|---|
Uptake |
Instrument Options |
0.35 ml/min |
Density |
Isotope Options |
19.3 g/cm3 (Au) |
Ionic response |
Isotope Options |
17.5 counts/ug (Au) |
Mass Fraction |
Isotope Options |
1.0 (Au) |
Diameter |
Transport Efficiency Calculator |
50 nm |
- Download the required sample and reference data files.
The
quad_sample_15nm.csvandquad_reference_50nm.csvfiles are available as a Zip archive example_1_data.zip on the GitHub. Download and extract the files.
- Import the sample file and reference files.
The
quad_sample_15nm.csvandquad_reference_50nm.csvfiles can be opened using File -> Open Sample File. Enter the sample parameters listed in Table 1.1. A detailed guide on the Data Import wizard is available.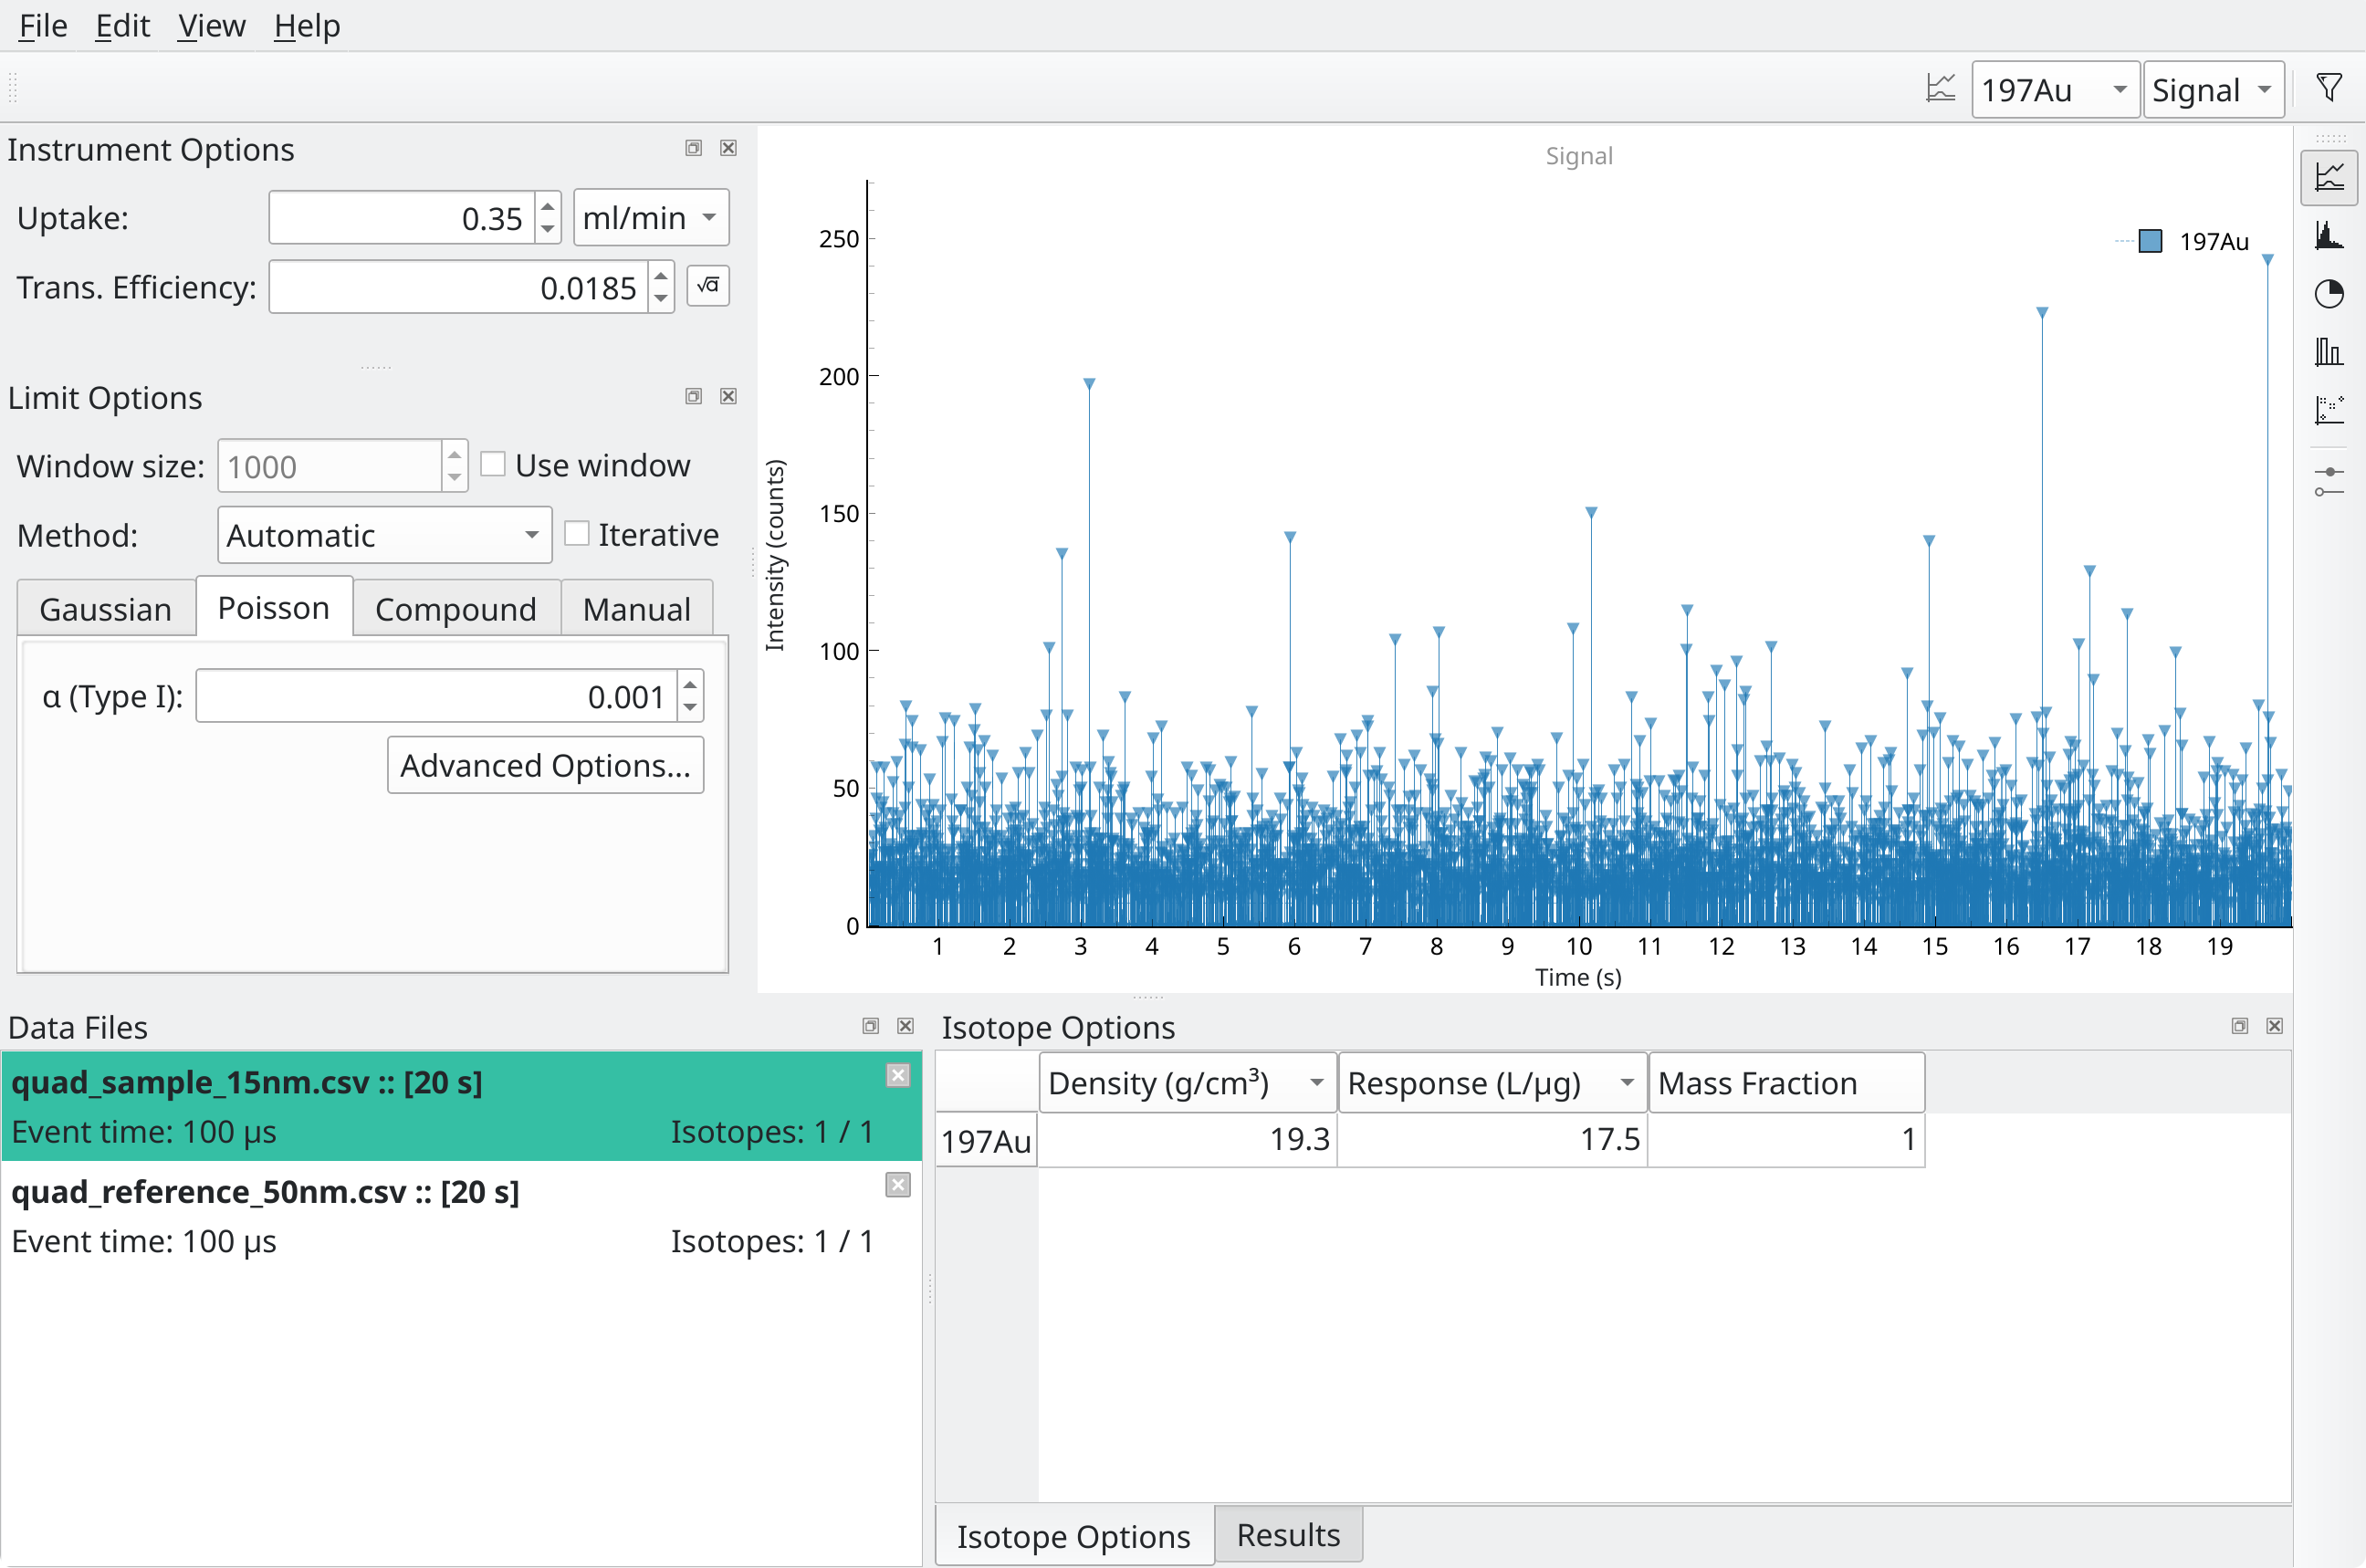
Fig. 1.1 The sample tab after importing
quad_sample_15nm.csvand entering the sample parameters.¶SPCal should look like Fig. 1.1.
- Enter the experiment parameters.
In the Instrument Options Dock, enter the uptake from Table 1.1. Enter the density, ionic response and mass fraction into the Isotope Options Dock. The button next to Trans. Efficiency should now be active.
- Calculate the transport efficiency.
Ensure that the reference data file is currently selected in the Data Files Dock! Press to button next to the Trans. Eddiciency field to open the Transport Efficiency Calculator. Most values should be pre-filled from the existing method. Enter the reference particle diameter listed in Table 1.1. The calculated efficiency should be close to 0.0185.
Check results and size histograms Switch to the sample file in the Data Files Dock. Set the current Key from Signal to Size using the controls in the top toolbar. The median and mean size listed in the Results Dock should be close to 15 nm.
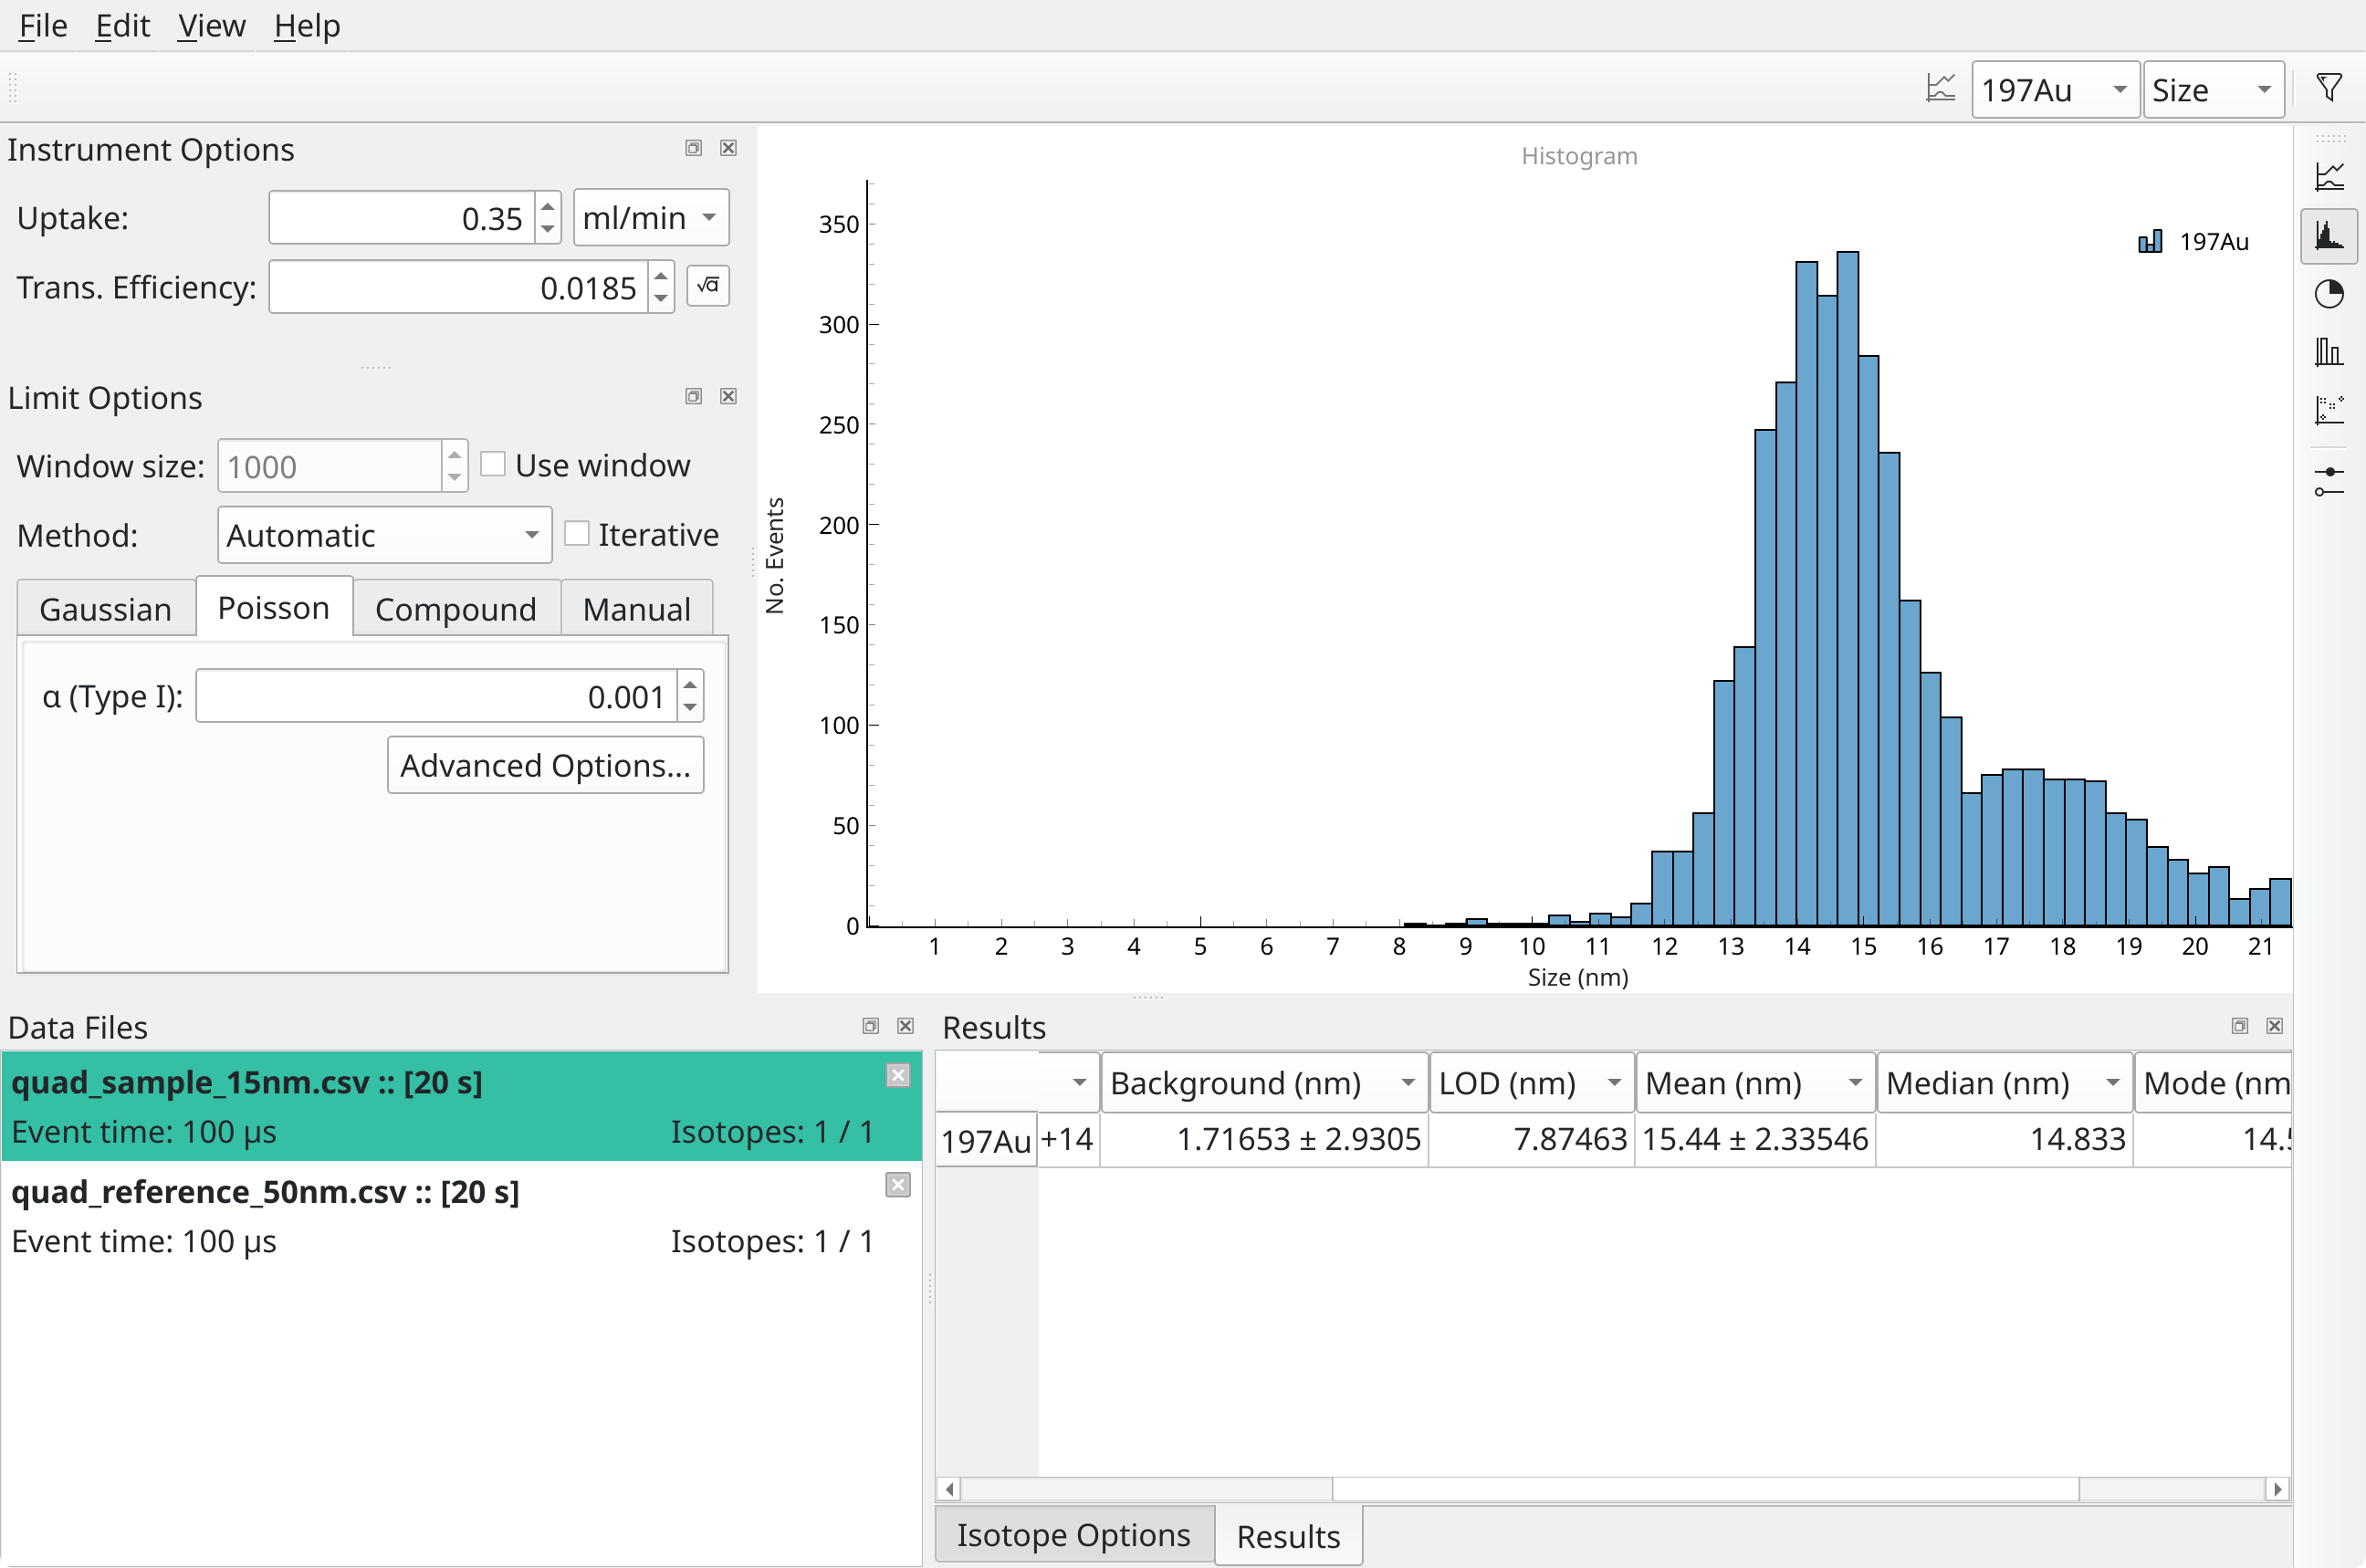
Fig. 1.2 SPCal histogram view after importing
quad_sample_15nm.csvand calibrating into sizes.¶The side toolbar can be used to show a histogram of the particle sizes, as in Fig. 1.2.
- Export the results.
Press File -> Export Results button to save the results to a file.